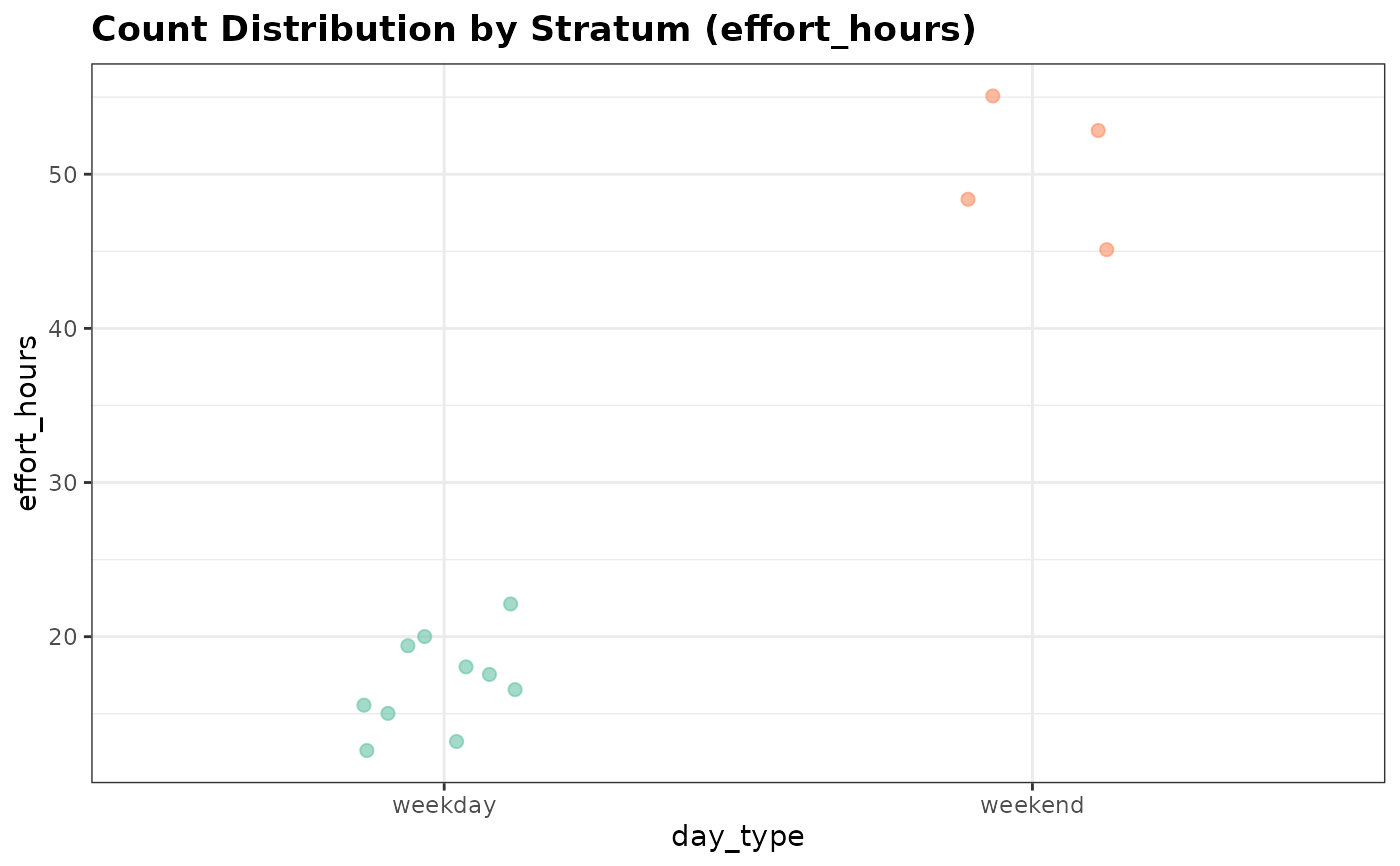
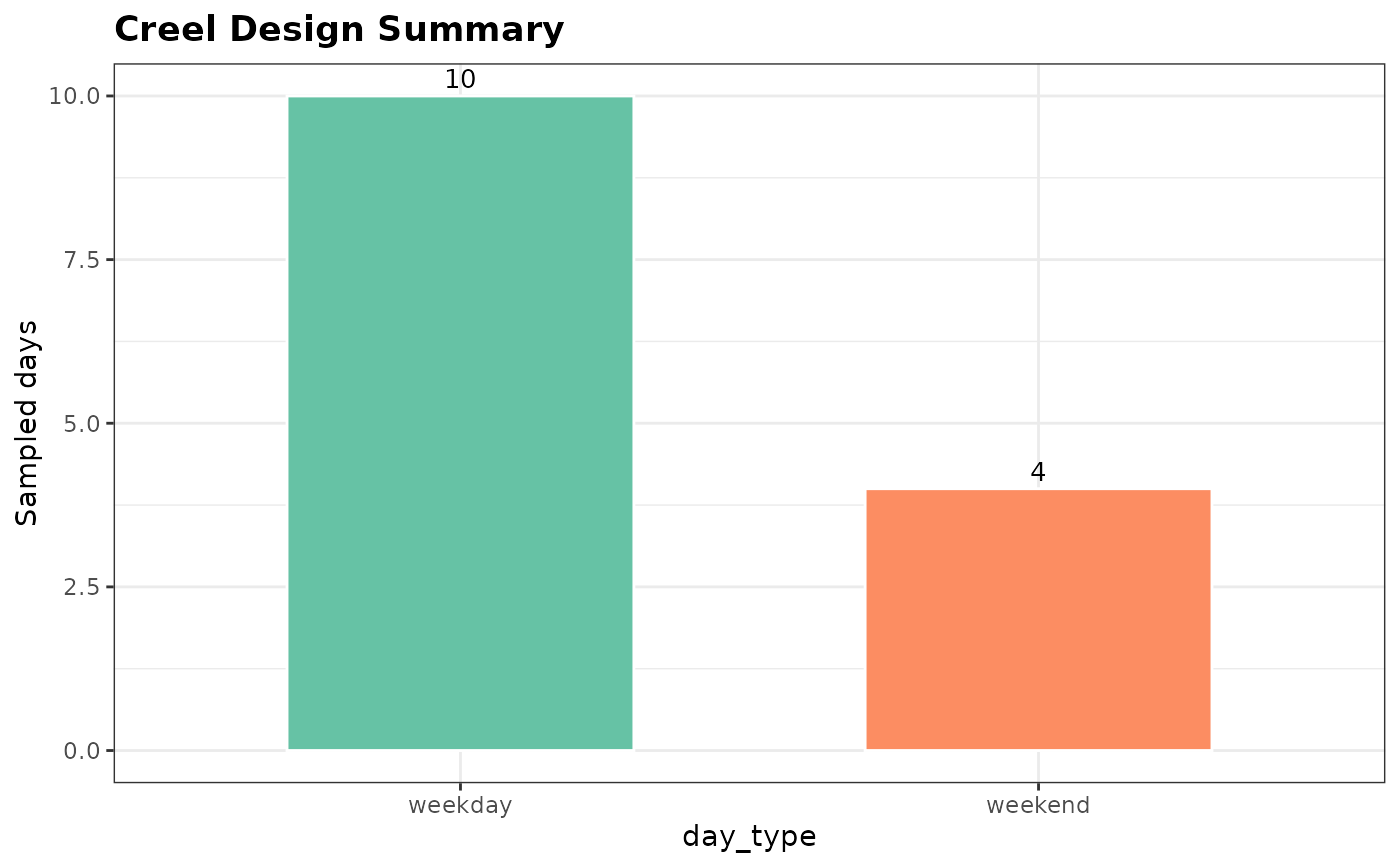
Produces a quick visual summary of a creel_design object:
Without counts attached (
design$countsisNULL): a bar chart showing the number of sampled days per stratum.With counts attached: a jitter + crossbar chart showing the distribution of count values per stratum.
Both variants colour bars/points by stratum for easy differentiation.
Arguments
- design
A
creel_designobject created bycreel_design().- title
Optional character title. Defaults to
"Creel Design Summary"(no counts) or"Count Distribution by Stratum"(with counts).- ...
Additional arguments (currently ignored).
Examples
data(example_calendar)
data(example_counts)
# Without counts — stratum sample sizes
design <- creel_design(example_calendar, date = date, strata = day_type)
plot_design(design)
 # With counts — count distribution per stratum
design_with_counts <- add_counts(design, example_counts)
#> Warning: No weights or probabilities supplied, assuming equal probability
plot_design(design_with_counts)
#> Warning: Computation failed in `stat_summary()`.
#> Caused by error in `fun.data()`:
#> ! The package "Hmisc" is required.
# With counts — count distribution per stratum
design_with_counts <- add_counts(design, example_counts)
#> Warning: No weights or probabilities supplied, assuming equal probability
plot_design(design_with_counts)
#> Warning: Computation failed in `stat_summary()`.
#> Caused by error in `fun.data()`:
#> ! The package "Hmisc" is required.