
Introduction
This vignette explains when and how incomplete-trip interviews can support catch estimation in roving-access creel surveys. The usual design uses complete-trip interviews, following Pollock et al. (1994). Incomplete-trip estimates may be appropriate in limited circumstances, but only after validation.
Use complete trips by default. Before relying on incomplete trips,
run the required statistical validation with
validate_incomplete_trips(). Never pool complete and
incomplete trips: their sampling probabilities differ.
This vignette shows:
- Scientific rationale for complete trip preference
- The recommended field protocol
- When incomplete trip estimation might be considered
- Step-by-step validation workflow
- Realistic examples of passing and failing validation
- Diagnostic comparison mode for research purposes
Scientific Rationale
Roving-Access Design Theory
The roving-access creel survey design combines two independent data streams (Pollock et al. 1994):
- Instantaneous counts — total effort (angler-hours) via periodic counts
- Complete trip interviews — catch per unit effort (CPUE) from anglers completing trips
This design is statistically optimal because:
- Counts provide unbiased effort estimates (snapshot of activity)
- Complete trip interviews provide unbiased CPUE (full trip information)
- Total catch = Effort × CPUE with independent variance estimation
Why Complete Trips Are Preferred
Complete trip interviews avoid length-of-stay bias. In roving-access designs, longer trips have higher probability of being sampled (they’re present for more count occasions). If incomplete trip catch rates differ systematically from complete trip catch rates—for example, if anglers who arrive early catch more fish per hour than late arrivals—then incomplete trip estimates will be biased.
Pollock et al. (1994) showed that:
- Complete trips provide unbiased CPUE estimates
- Incomplete trips suffer from length-of-stay bias unless catch rates are stationary
- Pooling complete and incomplete trips is invalid (different sampling probabilities)
For a roving-access survey, Pollock et al. (1994) recommend the following protocol:
- Default to complete trips only
- Require ≥10% of interviews to be complete trips
- Only use incomplete trips after validation
- Never auto-pool complete and incomplete trips
When Incomplete Trips Might Be Considered
Despite these concerns, incomplete-trip estimates can be valid when all of the following hold:
- Stationary catch rates — catch per hour is similar throughout trip duration
- Similar fishing behavior — complete and incomplete anglers fish the same way
- Sufficient sample size — at least 30 incomplete trip interviews
- Validation passes — TOST equivalence testing confirms similarity
Common scenarios for considering incomplete trips:
- Low complete trip sample size (but ≥10% threshold still met)
- Research questions specifically about incomplete trips
- Diagnostic comparisons to understand survey dynamics
- Exploring potential for future sampling protocols
Before considering incomplete trips, confirm that you have:
- Sufficient complete trip baseline (≥10% of interviews; Pollock et al. 1994)
- Adequate incomplete sample size (n ≥ 30 for stable estimates)
- Statistical validation using
validate_incomplete_trips() - Understanding of survey-specific fish behavior
Mean-of-Ratios vs. Ratio-of-Means
tidycreel uses different estimators for complete vs. incomplete trips:
Ratio-of-Means (complete trips, default):
CPUE = (Total Catch) / (Total Effort)This estimator is appropriate for complete trips because it accounts for the correlation between catch and effort within each trip. Variance is computed using the delta method.
Mean-of-Ratios (incomplete trips):
CPUE = mean(Catch_i / Effort_i)This estimator treats each incomplete trip’s catch rate as an independent observation. It’s used for incomplete trips because trip duration is unknown (trip not complete), making ratio-of-means inappropriate. The mean-of-ratios has higher variance but can be unbiased under stationarity assumptions.
For details on variance estimation, see
?estimate_catch_rate.
Recommended field protocol
The following roving-access standards follow Pollock et al. (1994).
Default Workflow: Complete Trips Only
library(tidycreel)

# Standard workflow using complete trips (default)
data(example_calendar)
data(example_counts)
data(example_interviews)

design <- creel_design(example_calendar, date = date, strata = day_type) |>
  add_counts(example_counts) |>
  add_interviews(example_interviews,
    catch = catch_total,
    effort = hours_fished,
    harvest = catch_kept,
    trip_status = trip_status,
    trip_duration = trip_duration
  )

# Estimate CPUE using complete trips only (default)
cpue <- estimate_catch_rate(design)
print(cpue)

# Estimate total catch
total_catch <- estimate_total_catch(design)
print(total_catch)
The package defaults to complete trips and displays an informative message:
i Using complete trips for CPUE estimation
  (n=17, 77% of 22 interviews) [default]
Sample Size Requirements
Pollock et al. (1994) recommend that complete trips make up at least 10% of interviews. tidycreel checks this automatically:
# If complete trip percentage drops below 10%, you'll see:
# Warning: Only 8% of interviews (n=5) are complete trips
# Best practice: ≥10% of interviews should be complete trips
# Consider extending survey hours or sampling more trips to completion
This warning appears before sample-size validation, so it remains visible even when too few observations cause an error.
For details, see ?warn_low_complete_pct and Phase 18
documentation.
Never pool complete and incomplete trips
Pooling complete and incomplete trips is scientifically invalid, even when validation passes.
Complete and incomplete trips have different sampling probabilities in roving-access designs. Longer trips have higher probability of being sampled during their incomplete phase, creating systematic bias if pooled with complete trips.
Pooling and substitution are different
Passing the TOST equivalence test does not permit pooling complete and incomplete trips. It supports a different decision:
Pooling — combining raw complete and incomplete records into one dataset and estimating as if they are the same type. This is always invalid, because the differential sampling probabilities create bias that no equivalence test removes. TOST only tells you whether the resulting CPUE estimates happen to agree; it says nothing about the compatibility of the underlying sampling mechanisms.
Substitution — choosing incomplete-trip estimates instead of complete-trip estimates as the sole basis for estimation. If TOST passes,
use_trips = "incomplete"selects that trip type; it does not combine the two.
In short: validation passes → you may substitute; you may never pool.
What NOT to Do
# WRONG: Do not manually pool trip types
all_interviews <- rbind(complete_data, incomplete_data)
estimate_catch_rate(design_with_all_data) # INVALID — always, even after validation passes

# WRONG: Do not use custom weights to combine
weighted_mean(c(complete_cpue, incomplete_cpue)) # INVALID!
Package Design Prevents Auto-Pooling
tidycreel never auto-pools complete and incomplete trips:
- Unspecified (
use_trips = NULL, the default): resolves to complete trips on an access-point design. On a roving design (interview_type = "roving") leaving it unspecified instead selects the all-trip mean-of-ratios estimator of Hoenig et al. (1997) — see “What the default does on a roving design” below. Naming eitheruse_tripsorestimatorsuppresses that routing. - Explicit option:
use_trips = "incomplete"for incomplete only (valid after passing validation) - Diagnostic mode:
use_trips = "diagnostic"for side-by-side comparison (not pooling)
There is no use_trips = "both" option because pooling is
invalid.
“Pooling” here means one ratio-of-means fitted over complete and
incomplete trips together, which is invalid because the two have
different sampling probabilities. The roving route described above is
not that: all-trip mean-of-ratios treats each contact’s catch rate as
its own observation, which is what makes it valid over trips of unknown
duration. It does use every contact, so if you need complete trips
specifically, name them — the absence of a "both" option is
not on its own a guarantee that you are getting complete-trip-only
estimates.
What the default does on a roving design
Leaving use_trips unspecified is not the same as asking
for complete trips.
On an access-point design the two are equivalent: an unspecified
value resolves to complete trips. On a roving design
they are not. When interview_type = "roving" and neither
use_trips nor estimator is named, tidycreel
selects the all-trip mean-of-ratios estimator of Hoenig et al. (1997),
because that is the estimator the roving design calls for — not because
complete trips were unavailable.
The method field reports which one ran, so the
difference is visible rather than silent:
roving_design <- creel_design(
  example_calendar,
  date = date, strata = day_type,
  survey_type = "instantaneous", h_open = 14
) |>
  add_counts(example_counts, count_col = effort_hours) |>
  add_interviews(
    example_interviews,
    catch = catch_total, effort = hours_fished, n_anglers = n_anglers,
    harvest = catch_kept, trip_status = trip_status,
    trip_duration = trip_duration,
    interview_type = "roving"
  )
#> Warning in svydesign.default(ids = psu_formula, strata = strata_formula, : No
#> weights or probabilities supplied, assuming equal probability
#> ℹ Added 22 interviews: 17 complete (77%), 5 incomplete (23%)

# Unspecified: routed to all-trip mean-of-ratios
estimate_catch_rate(roving_design)$method
#> ℹ Roving design: using all 22 interviews for CPUE via MOR [auto]
#>   (17 complete, 5 incomplete)
#>   Override with `use_trips = 'complete'` for access-point estimation.
#> ℹ MOR truncation: 0 trips excluded (all >= 0.5 hours)
#> Warning: Small sample size for CPUE estimation.
#> ! Sample size is 22. Ratio estimates are more stable with n >= 30.
#> ℹ Variance estimates may be unstable with n < 30.
#> [1] "mean-of-ratios-cpue"

# Named explicitly: complete trips, ratio-of-means
estimate_catch_rate(roving_design, use_trips = "complete")$method
#> ℹ Using complete trips for CPUE estimation
#>   (n=17, 77.3% of 22 interviews)
#> Warning: Small sample size for CPUE estimation.
#> ! Sample size is 17. Ratio estimates are more stable with n >= 30.
#> ℹ Variance estimates may be unstable with n < 30.
#> [1] "ratio-of-means-cpue"
The two answers differ, and on a roving design the routed one is
usually the one you want. The point is that “the default” is not
a synonym for “complete trips” on this design type. Wherever
this vignette tells you to estimate from complete trips — including
after a failed validation — name use_trips = "complete"
rather than relying on the default to mean that.
If you need to compare complete vs. incomplete estimates, use diagnostic comparison mode (see section below) or validation workflow (next section).
Step-by-Step Validation Workflow
Before using incomplete-trip estimates, validate that they agree sufficiently with complete-trip estimates. The workflow is:
Step 1: Load Data with Both Trip Types
library(tidycreel)

# Your survey data should have trip_status field
# Check trip type distribution
table(your_interviews$trip_status)

# Ensure you have:
# - At least 10% complete trips (Pollock et al. 1994)
# - At least 30 incomplete trips (for stable estimates)
# - At least 10 complete trips (for ratio estimation)
Step 2: Create Design and Attach Data
design <- creel_design(your_calendar, date = date, strata = day_type) |>
  add_counts(your_counts) |>
  add_interviews(your_interviews,
    catch = catch_total,
    effort = hours_fished,
    trip_status = trip_status,
    trip_duration = trip_duration
  )
Step 3: Run TOST Equivalence Testing
# Validate incomplete trips using TOST
validation <- validate_incomplete_trips(design,
  catch = catch_total,
  effort = hours_fished
)

print(validation)
The validate_incomplete_trips() function performs Two
One-Sided Tests (TOST) to statistically test whether complete and
incomplete trip CPUE estimates are equivalent within a threshold.
TOST explanation:
- Traditional t-test can only reject difference, not prove similarity
- TOST statistically proves estimates are “close enough”
- Tests null hypothesis: |difference| ≥ threshold
- Equivalence concluded when both one-sided tests reject (both p < 0.05)
- Standard approach for bioequivalence and ecological studies
Step 4: Interpret Results
If validation PASSES:
Incomplete Trip Validation (TOST Equivalence Test)

Overall Result: PASSED

Complete trips:   CPUE = 2.45 fish/hour (SE = 0.23, n = 45)
Incomplete trips: CPUE = 2.38 fish/hour (SE = 0.18, n = 120)

Equivalence threshold: ±20% of complete trip estimate (±0.49 fish/hour)
Difference: 0.07 fish/hour (3% of complete estimate)

TOST p-values: p1 = 0.012, p2 = 0.008
Equivalence: YES (both p < 0.05)

Recommendation: Incomplete trip estimates are statistically equivalent to
complete trip estimates within ±20% threshold. Safe to use incomplete trips
for this dataset.
If validation FAILS:
Incomplete Trip Validation (TOST Equivalence Test)

Overall Result: FAILED

Complete trips:   CPUE = 3.10 fish/hour (SE = 0.31, n = 38)
Incomplete trips: CPUE = 2.15 fish/hour (SE = 0.19, n = 95)

Equivalence threshold: ±20% of complete trip estimate (±0.62 fish/hour)
Difference: 0.95 fish/hour (31% of complete estimate)

TOST p-values: p1 = 0.234, p2 = 0.891
Equivalence: NO (at least one p >= 0.05)

Recommendation: Incomplete trip estimates are NOT equivalent to complete
trip estimates. Stick with complete trips only (Pollock et al. 1994).
Step 5: View Validation Plot
# Print method automatically shows plot
print(validation) # Plot appears after text output

# Or explicitly plot
plot(validation)
The validation plot shows a scatter plot with:
- Complete trip estimate on x-axis
- Incomplete trip estimate on y-axis
- Reference line at y = x (perfect agreement)
- Equivalence bounds as shaded region
- Color: blue if passed, red if failed
Step 6: Make Decision
If PASSED: - Safe to use
use_trips = "incomplete" for this dataset - Consider using
use_trips = "diagnostic" to compare estimates - Document
validation results in your analysis notes - Revalidate if survey
protocol or location changes
If FAILED: - Pass
use_trips = "complete" explicitly — do not
rely on the default (see “What the default does on a roving design”) -
Do not use incomplete trip estimates - Investigate why estimates differ
(time of day effects, early vs. late anglers) - Consider refining
sampling protocol for future surveys
Example: Validation Passes
Here’s a realistic scenario where incomplete trip validation passes because catch rates are stationary throughout the day.
library(tidycreel)

# Simulate data where catch rates are similar for complete vs incomplete
set.seed(42)

# Create calendar
calendar <- data.frame(
  date = seq.Date(as.Date("2024-06-01"), as.Date("2024-06-14"), by = "day"),
  day_type = rep(c("weekday", "weekend"), length.out = 14)
)

# Create counts
counts <- data.frame(
  date = calendar$date,
  day_type = calendar$day_type,
  effort_hours = round(runif(14, min = 50, max = 150))
)

# Simulate interviews with SIMILAR catch rates for both trip types
# (stationary catch rate throughout day)
n_complete <- 50
n_incomplete <- 120

# Base CPUE around 2.4 fish/hour for both groups (PASSING scenario)
complete_interviews <- data.frame(
  date = sample(calendar$date, n_complete, replace = TRUE),
  hours_fished = runif(n_complete, min = 2, max = 8),
  trip_status = "complete",
  trip_duration = runif(n_complete, min = 2, max = 8)
)
complete_interviews$catch_total <- rpois(n_complete,
  lambda = complete_interviews$hours_fished * 2.4
)

incomplete_interviews <- data.frame(
  date = sample(calendar$date, n_incomplete, replace = TRUE),
  hours_fished = runif(n_incomplete, min = 1, max = 6),
  trip_status = "incomplete"
)
# For incomplete trips, trip_duration = hours_fished (time interviewed, not total trip)
incomplete_interviews$trip_duration <- incomplete_interviews$hours_fished
# Similar CPUE for incomplete trips (2.3-2.5 range)
incomplete_interviews$catch_total <- rpois(n_incomplete,
  lambda = incomplete_interviews$hours_fished * 2.35
)

interviews <- rbind(complete_interviews, incomplete_interviews)

# Create design
design <- creel_design(calendar, date = date, strata = day_type) |>
  add_counts(counts) |>
  add_interviews(interviews,
    catch = catch_total,
    effort = hours_fished,
    trip_status = trip_status,
    trip_duration = trip_duration
  )
#> Warning in svydesign.default(ids = psu_formula, strata = strata_formula, : No
#> weights or probabilities supplied, assuming equal probability
#> Warning: ! No `n_anglers` provided — assuming 1 angler per interview.
#> ℹ Pass `n_anglers = <column>` to use actual party sizes for angler-hour
#>   normalization.
#> ℹ If the interviews really are one angler each, pass `n_anglers = 1` to state
#>   that and silence this warning.
#> ℹ Added 170 interviews: 50 complete (29%), 120 incomplete (71%)

# Run validation
validation_pass <- validate_incomplete_trips(design,
  catch = catch_total,
  effort = hours_fished
)

print(validation_pass)
#>
#> ── TOST Equivalence Validation Results ─────────────────────────────────────────
#> Threshold: ±20% of complete trip estimate
#> ✔ Validation PASSED
#>
#> Recommendation: Validation passed: Safe to use incomplete trips for CPUE
#> estimation in this dataset
#>
#>
#> ── Overall Test ──
#>
#> Complete trips: n = 50, CPUE = 2.297
#> Incomplete trips: n = 120, CPUE = 2.312
#> Difference: -0.015
#> Equivalence bounds: [-0.459, 0.459]
#> TOST p-values: p_lower = 4e-04, p_upper = 2e-04
#> ✔ Overall equivalence: PASSED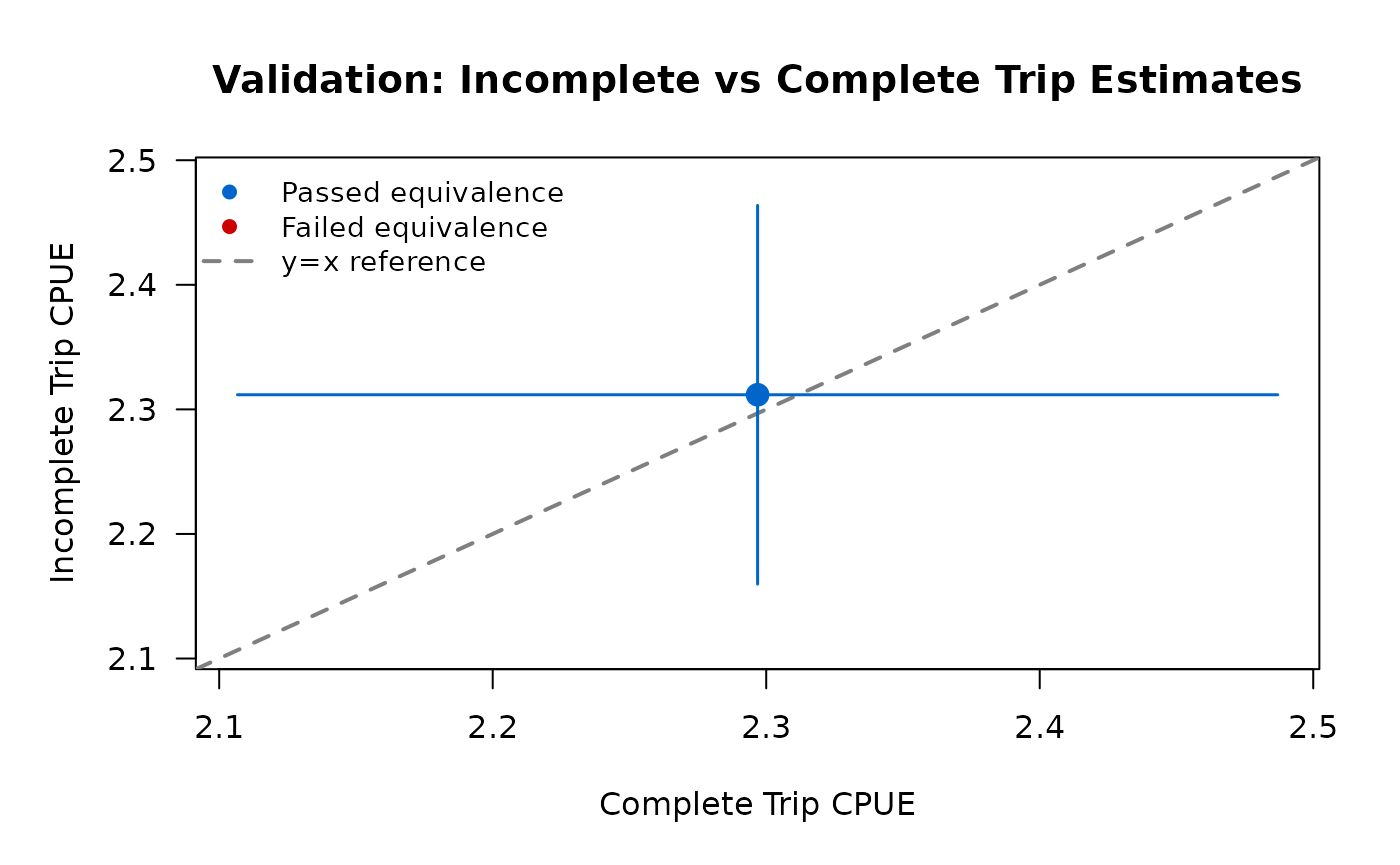
Interpretation:
- Complete and incomplete CPUE estimates are very close (within ~5%)
- Both TOST p-values < 0.05 → equivalence confirmed
- Validation PASSED → safe to use incomplete trips for this dataset
- Plot shows estimates within equivalence bounds
Next steps after passing validation:
# Now safe to use incomplete trips
cpue_incomplete <- estimate_catch_rate(design, use_trips = "incomplete")
print(cpue_incomplete)

# Or use diagnostic mode to compare
cpue_diagnostic <- estimate_catch_rate(design, use_trips = "diagnostic")
print(cpue_diagnostic)
Example: Validation Fails
Here’s a realistic scenario where validation fails because early-morning anglers catch fish at higher rates than afternoon anglers.
library(tidycreel)
set.seed(123)

# Same calendar and counts as before
calendar <- data.frame(
  date = seq.Date(as.Date("2024-06-01"), as.Date("2024-06-14"), by = "day"),
  day_type = rep(c("weekday", "weekend"), length.out = 14)
)

counts <- data.frame(
  date = calendar$date,
  day_type = calendar$day_type,
  effort_hours = round(runif(14, min = 50, max = 150))
)

# Simulate interviews with DIFFERENT catch rates (FAILING scenario)
# Complete trips average full day (includes productive morning hours)
# Incomplete trips are mostly afternoon interviews (lower catch rates)

n_complete <- 45
n_incomplete <- 110

# Complete trips: higher CPUE (includes morning fishing, ~3.0 fish/hour)
complete_interviews <- data.frame(
  date = sample(calendar$date, n_complete, replace = TRUE),
  hours_fished = runif(n_complete, min = 3, max = 8),
  trip_status = "complete",
  trip_duration = runif(n_complete, min = 3, max = 8)
)
complete_interviews$catch_total <- rpois(n_complete,
  lambda = complete_interviews$hours_fished * 3.0
)

# Incomplete trips: lower CPUE (afternoon interviews, ~2.0 fish/hour)
incomplete_interviews <- data.frame(
  date = sample(calendar$date, n_incomplete, replace = TRUE),
  hours_fished = runif(n_incomplete, min = 1, max = 5),
  trip_status = "incomplete"
)
# For incomplete trips, trip_duration = hours_fished (time interviewed, not total trip)
incomplete_interviews$trip_duration <- incomplete_interviews$hours_fished
incomplete_interviews$catch_total <- rpois(n_incomplete,
  lambda = incomplete_interviews$hours_fished * 2.0
)

interviews_biased <- rbind(complete_interviews, incomplete_interviews)

# Create design
design_biased <- creel_design(calendar, date = date, strata = day_type) |>
  add_counts(counts) |>
  add_interviews(interviews_biased,
    catch = catch_total,
    effort = hours_fished,
    trip_status = trip_status,
    trip_duration = trip_duration
  )
#> Warning in svydesign.default(ids = psu_formula, strata = strata_formula, : No
#> weights or probabilities supplied, assuming equal probability
#> Warning: ! No `n_anglers` provided — assuming 1 angler per interview.
#> ℹ Pass `n_anglers = <column>` to use actual party sizes for angler-hour
#>   normalization.
#> ℹ If the interviews really are one angler each, pass `n_anglers = 1` to state
#>   that and silence this warning.
#> ℹ Added 155 interviews: 45 complete (29%), 110 incomplete (71%)

# Run validation
validation_fail <- validate_incomplete_trips(design_biased,
  catch = catch_total,
  effort = hours_fished
)

print(validation_fail)
#>
#> ── TOST Equivalence Validation Results ─────────────────────────────────────────
#> Threshold: ±20% of complete trip estimate
#> ✖ Validation FAILED
#>
#> Recommendation: Validation failed: Use complete trips only (estimates not
#> statistically equivalent)
#>
#>
#> ── Overall Test ──
#>
#> Complete trips: n = 45, CPUE = 3.103
#> Incomplete trips: n = 110, CPUE = 2.045
#> Difference: 1.059
#> Equivalence bounds: [-0.621, 0.621]
#> TOST p-values: p_lower = 0, p_upper = 0.9996
#> ✖ Overall equivalence: FAILED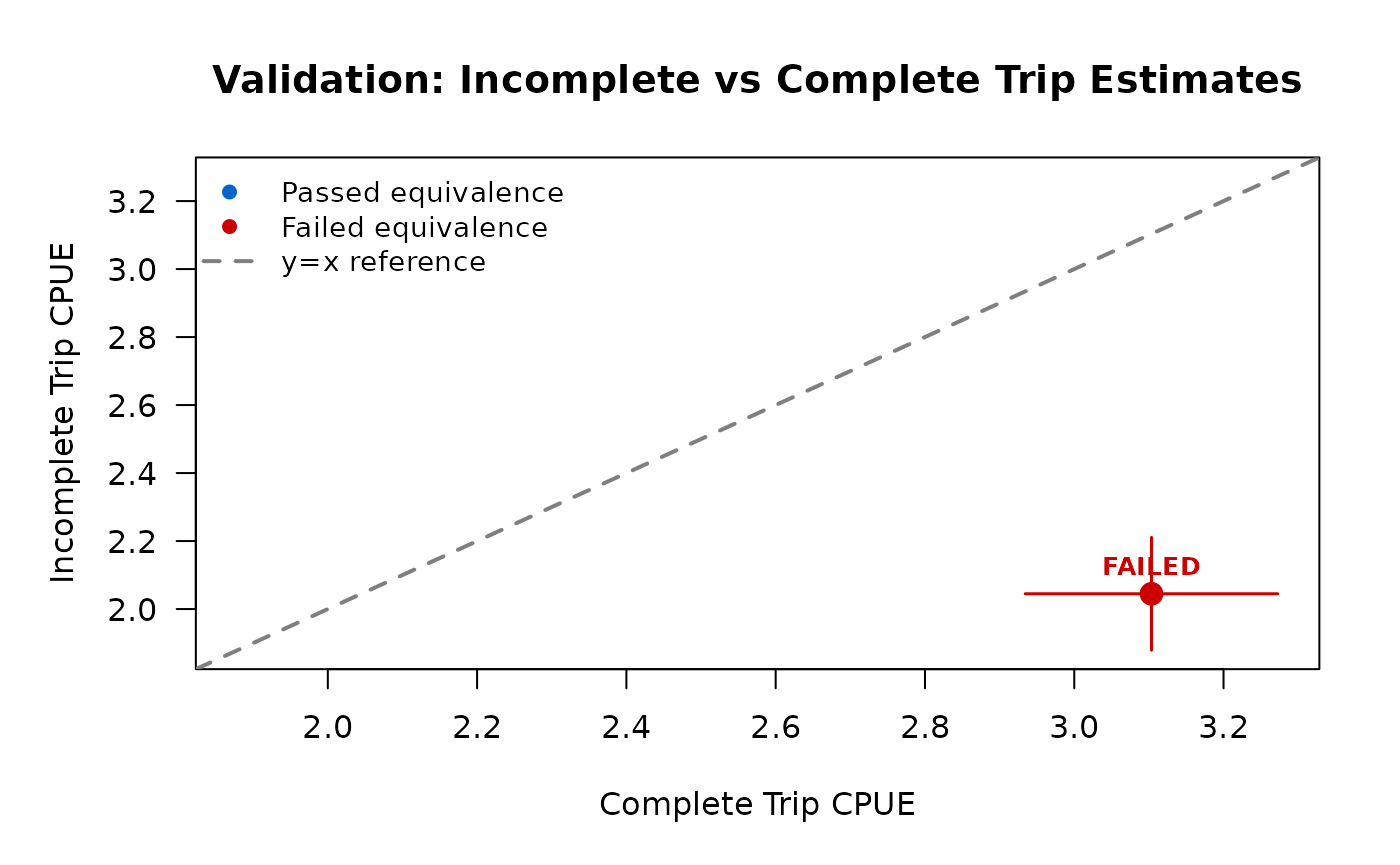
Interpretation:
- Complete trip CPUE (~3.0) is substantially higher than incomplete CPUE (~2.0)
- Difference is ~33% of complete estimate, exceeds ±20% threshold
- At least one TOST p-value ≥ 0.05 → equivalence NOT confirmed
- Validation FAILED → stick with complete trips only
- Plot shows estimates outside equivalence bounds (red)
Correct action after failing validation:
# DO NOT use incomplete trips
# Stick with default complete trip estimation
# `design_biased` is an access-point design, so an unspecified `use_trips`
# resolves to complete trips. On a roving design it would not -- name it.
cpue_complete <- estimate_catch_rate(design_biased, use_trips = "complete")
print(cpue_complete)

# Investigate why estimates differ
# Possible reasons:
# - Time-of-day effects (morning vs afternoon catch rates)
# - Trip length correlates with skill level
# - Fish behavior changes throughout day (feeding windows)
# - Different angler types (early vs late arrivals)
Using Diagnostic Comparison Mode
For research purposes or to understand your survey dynamics, use diagnostic comparison mode to see complete and incomplete estimates side-by-side without statistical testing.
# Compare complete vs incomplete estimates
cpue_diagnostic <- estimate_catch_rate(design,
  catch = catch_total,
  effort = hours_fished,
  use_trips = "diagnostic"
)

print(cpue_diagnostic)
Example output:
Diagnostic Comparison: Complete vs Incomplete Trip CPUE

trip_type    estimate    se  ci_lower  ci_upper   n
complete         2.45  0.23      2.00      2.90  45
incomplete       2.38  0.18      2.03      2.73 120

Difference: 0.07 fish/hour (3% of complete estimate)
Ratio: 1.03 (complete / incomplete)

Interpretation: Estimates differ by <10%, suggesting similar catch rates
When to Use Diagnostic Mode
Diagnostic mode is useful for:
- Exploring survey dynamics before formal validation
- Understanding differences between trip types
- Research questions about fishing patterns
- Teaching or demonstrating survey concepts
- Sensitivity analyses
Diagnostic mode is NOT a replacement for validation:
- Provides descriptive comparison, not statistical test
- No p-values or equivalence assessment
- No pass/fail recommendation
- Use
validate_incomplete_trips()for decision-making
Interpretation Guidance
The diagnostic mode uses a 10% threshold for “substantial difference” (established in Phase 17):
- Difference < 10%: Estimates are similar, no practical difference
- Difference ≥ 10%: Estimates differ substantially, investigate further
This is a heuristic, not a statistical test. For formal validation,
use validate_incomplete_trips().
Advanced: Grouped Validation
When estimating CPUE by strata (e.g., by day type), validate within each group:
# Validate with grouping
validation_grouped <- validate_incomplete_trips(design,
  catch = catch_total,
  effort = hours_fished,
  by = day_type
)

print(validation_grouped)
Grouped validation requires:
- Overall equivalence (all groups combined)
- AND per-group equivalence (each group separately)
This conservative approach prevents overlooking group-specific bias that could be masked by overall equivalence.
Example grouped output:
Incomplete Trip Validation (Grouped by day_type)

Overall Result: FAILED

Overall (ungrouped):
  Complete: 2.45 fish/hour (n=45)
  Incomplete: 2.38 fish/hour (n=120)
  TOST: PASSED (p1=0.012, p2=0.008)

Group: weekday
  Complete: 2.20 fish/hour (n=20)
  Incomplete: 2.15 fish/hour (n=55)
  TOST: PASSED (p1=0.031, p2=0.019)

Group: weekend
  Complete: 2.80 fish/hour (n=25)
  Incomplete: 2.45 fish/hour (n=65)
  TOST: FAILED (p1=0.156, p2=0.234)

Recommendation: Overall equivalence passed but weekend group failed.
Do not use incomplete trips. Investigate group-specific differences.
Even though overall validation passed, the weekend group failed—incomplete trip estimates are biased on weekends. This demonstrates why grouped validation is conservative.
Technical Details
TOST Equivalence Testing
Two One-Sided Tests (TOST) tests the null hypothesis:
H0: |μ_complete - μ_incomplete| ≥ δ
H1: |μ_complete - μ_incomplete| < δ
Where δ is the equivalence threshold (default ±20% of complete estimate).
Two one-sided tests:
- Test 1: H0: μ_complete - μ_incomplete ≤ -δ vs H1: μ_complete - μ_incomplete > -δ
- Test 2: H0: μ_complete - μ_incomplete ≥ δ vs H1: μ_complete - μ_incomplete < δ
Equivalence conclusion:
- Both p-values < 0.05 → equivalence confirmed (PASSED)
- At least one p ≥ 0.05 → equivalence not confirmed (FAILED)
For mathematical details and variance formulas, see
?validate_incomplete_trips.
Equivalence Threshold Configuration
The default equivalence threshold is ±20% of the complete trip estimate, appropriate for ecological field data. You can customize this:
# Use stricter threshold (±15%)
options(tidycreel.equivalence_threshold = 0.15)
validation_strict <- validate_incomplete_trips(design,
  catch = catch_total,
  effort = hours_fished
)

# Use more permissive threshold (±25%)
options(tidycreel.equivalence_threshold = 0.25)
validation_permissive <- validate_incomplete_trips(design,
  catch = catch_total,
  effort = hours_fished
)
Choosing a threshold:
- Stricter (10-15%): High-stakes management decisions, research publications
- Default (20%): Standard ecological field studies, typical survey variability
- Permissive (25-30%): Exploratory analyses, preliminary surveys
The threshold should balance statistical rigor with realistic field variability. Consult with statistician or fisheries biologist for your specific application.
Trip Truncation
Incomplete trips with very short durations (<30 minutes) can inflate variance and bias estimates. tidycreel automatically truncates short incomplete trips using the Hoenig et al. (1997) recommended threshold:
# Default: truncate incomplete trips <0.5 hours (30 minutes)
cpue_incomplete <- estimate_catch_rate(design,
  use_trips = "incomplete",
  estimator = "mor",
  truncate_at = 0.5 # Default
)

# Custom truncation threshold
cpue_truncated <- estimate_catch_rate(design,
  use_trips = "incomplete",
  estimator = "mor",
  truncate_at = 1.0 # More conservative: only trips ≥1 hour
)

# Disable truncation (not recommended)
cpue_no_truncation <- estimate_catch_rate(design,
  use_trips = "incomplete",
  estimator = "mor",
  truncate_at = 0 # Includes all incomplete trips
)
The MOR print method shows truncation details:
Truncation: 8 of 120 incomplete trips removed (<0.5 hours)
Warning: 7% of incomplete trips truncated (>5% threshold)
For details on truncation methodology, see
?estimate_catch_rate and Phase 16 documentation.
Mean-of-Ratios Variance
The mean-of-ratios estimator computes:
CPUE_MOR = (1/n) * Σ(catch_i / effort_i)Variance is estimated with the survey package, treating individual ratios as observations. The survey design is rebuilt after short incomplete trips are truncated so the variance calculation reflects the analytic sample.
This differs from ratio-of-means which uses delta method variance accounting for catch-effort covariance.
Summary and Recommendations
Decision Tree: Should I Use Incomplete Trips?
-
Do you have ≥10% complete trip interviews?
- NO → Improve sampling protocol, extend survey hours
- YES → Continue
-
Do you have ≥30 incomplete trip interviews?
- NO → Sample size too small, stick with complete trips
- YES → Continue
-
Have you run
validate_incomplete_trips()?- NO → Run validation before proceeding
- YES → Continue
-
Did validation PASS?
- NO → Stick with complete trips only
- YES → Safe to use incomplete trips for this dataset
-
Are you analyzing grouped estimates?
- YES → Did ALL groups pass validation?
- NO → Stick with complete trips
- YES → Safe to use incomplete trips
- NO → Proceed
- YES → Did ALL groups pass validation?
- Document validation results and proceed with incomplete trip estimation
Default Recommendations
For most creel surveys:
- Use complete trips only (default behavior)
- Follow the Pollock et al. (1994) protocol
- Aim for ≥10% complete trip interviews
- Sample size goal: n ≥ 30 complete trips per stratum
When considering incomplete trips:
- Validate using
validate_incomplete_trips()FIRST - Document validation results (passed/failed, p-values, threshold)
- Revalidate if survey protocol or location changes
- Monitor for seasonal or temporal changes in catch patterns
Never:
- Pool complete and incomplete trips without validation
- Use incomplete trips without statistical validation
- Auto-pool trip types (package prevents this by design)
- Trust incomplete estimates that failed validation
Function Reference
For detailed documentation, see:
-
?validate_incomplete_trips— TOST equivalence testing -
?estimate_catch_rate— CPUE estimation with use_trips parameter -
?add_interviews— Attach interview data with trip_status -
?example_interviews— Example data with complete/incomplete trips
For complete trip estimation workflow, see the “Interview-Based Catch Estimation” vignette.
Further Reading
Key citations:
- Pollock, K.H., C.M. Jones, and T.L. Brown. 1994. Angler Survey Methods and Their Applications in Fisheries Management. American Fisheries Society Special Publication 25.
- Hoenig, J.M., C.M. Jones, K.H. Pollock, D.S. Robson, and D.L. Wade. 1997. Calculation of Catch Rate and Total Catch in Roving Surveys of Anglers. Biometrics 53:306-317.
Related package documentation:
- Phase 17: Complete Trip Defaults and Diagnostic Mode
- Phase 18: Sample Size Validation and Warnings
- Phase 19: TOST Equivalence Testing Framework
- Phase 16: Trip Truncation for Incomplete Interviews