Why a Creel Survey Needs Linked Tables
Keeping counts, interviews, catch, and fish measurements connected
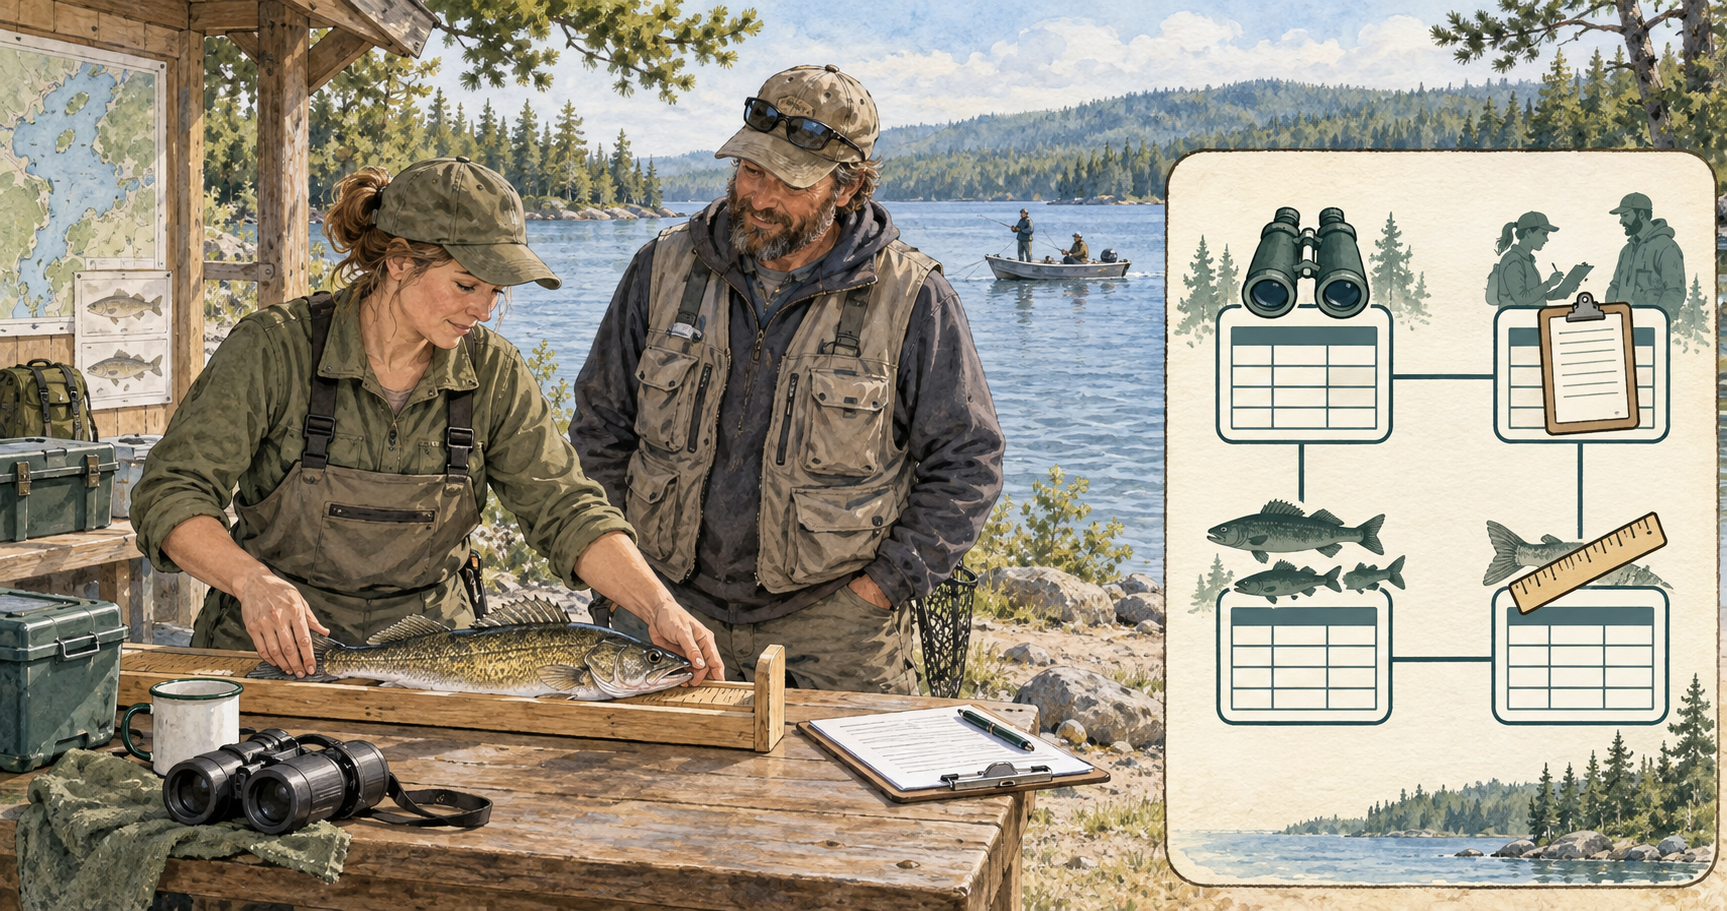
The previous post asked how an angler entered the interview sample. This post follows those observations back to the data: what does one row represent, and how does it connect to the rest of the survey?
A count records fishing activity at a particular place and time. An interview records information about a trip or party. Catch records describe species and what happened to the fish. Length and age records describe the fish sampled for biological information. These observations belong together in an analysis, but they do not all belong on the same row.
In brief
- Keep each table at its own unit of observation.
- Link catch and biological records to interviews with stable identifiers.
- Preserve interviews with zero catch and distinguish them from missing data.
- Attach the tables to the design before asking what they estimate.
The example below uses tidycreel 7.0.0, “Goldeye”, and the simulated data shipped with that release. Its release notes also document a change directly relevant here: interview identifiers are normalized to character when catch, length, and age tables are attached.
Start with what one row means
Before joining anything, I want to be able to finish this sentence for every table: one row represents… That answer tells us which values can be repeated and which must remain unique.
For the instantaneous-count workflow used here, the main tables have these roles:
| Table | What one row represents | How it connects |
|---|---|---|
| Calendar | A date or sampling unit in the declared design | Dates, strata, and other design keys |
| Counts | A count event at a recorded time | Calendar dates and applicable sampling-unit keys |
| Interviews | An interviewed trip or party under the field protocol | Calendar/design keys and an interview identifier |
| Catch | A species and catch type within an interview | Interview identifier |
| Lengths | An individual fish measurement or a release-length bin | Interview identifier and species |
| Ages | An individual aged fish | Interview identifier and species |
The sampling-calendar post explained why dates and strata matter. Here, the additional connection is the interview identifier. It allows several species records and several fish measurements to belong to the same interview without turning that interview into several independent trips.
Counts do not need to belong to individual interviews. A clerk might count anglers across a section and interview only some of them. Connecting every count to every interview on that date would create combinations that the field crew never observed.
One large spreadsheet can quietly repeat effort
Suppose an interview records four hours of fishing and catch of two species. A species-level table needs at least two rows to describe that catch. If we join those rows to the interview, the four hours appear twice. Summing the joined effort column now gives eight hours, although only four were reported.
Adding individual fish measurements can multiply rows again. Three length records for one species are three measurements, not three more interviews.
A join can be useful for a particular question. The problem is forgetting that it changes what a row represents. Keeping the original tables separate gives us a way to check a derived table against the observations that produced it.
This is the practical role of the design object. It holds the related tables and the information needed to interpret them, without requiring us to flatten everything into one spreadsheet.
Attach counts and interviews first
The first part of the example should look familiar. Define the calendar, attach counts, and then attach interviews with their catch and effort fields. The interview type remains explicit for the same reason discussed in the last post: it documents how the observations were collected.
library(tidycreel)

# This walkthrough was checked against version 7.0.0.
packageVersion("tidycreel")

data(example_calendar)
data(example_counts)
data(example_interviews)
data(example_catch)
data(example_lengths)
data(example_ages)

design <- creel_design(
  example_calendar,
  date = date,
  strata = day_type
) |>
  add_counts(example_counts) |>
  add_interviews(
    example_interviews,
    catch = catch_total,
    effort = hours_fished,
    harvest = catch_kept,
    trip_status = trip_status,
    trip_duration = trip_duration,
    n_anglers = n_anglers,
    interview_type = "access"
  )
This example declares access-point interviews. A roving survey should retain its own interview type and appropriate trip information; organizing the tables does not change the sampling protocol. The example also produces an equal-probability warning because it supplies no explicit sampling weights. It demonstrates table attachment; a survey with unequal selection probabilities needs those probabilities represented in its design before estimation.
The interview table still contains one row per interview, including interviews with no catch. Those zero-catch observations matter when estimating rates. A catch table alone cannot tell us how much fishing occurred without a fish being caught.
Link species-level catch to its interview
add_catch() attaches the species detail through the interview identifier. The two identifier arguments describe opposite sides of that link: catch_uid is the interview ID column in the catch table, and interview_uid is its counterpart in the interview table. Despite its name, catch_uid is not a unique identifier for each fish or catch row.
design <- design |>
  add_catch(
    example_catch,
    catch_uid = interview_id,
    interview_uid = interview_id,
    species = species,
    count = count,
    catch_type = catch_type
  )
The catch table uses "caught", "harvested", and "released" to describe catch type. Caught is the total; harvested and released are components. Adding all three together would count fish twice. If a caught row is absent, the package derives that total from harvested plus released. If it is present, it must be at least their sum. These rules are documented in add_catch().
An interview can legitimately have no catch rows when nothing was caught. That is different from losing its catch records during an export. The software cannot reconstruct that distinction from an absent row, so the data-preparation workflow must establish what absence means. Version 7.0.0 rejects NA catch counts rather than silently treating an unknown count as zero. Dropping a row with an unknown count is therefore a substantive decision, not a harmless fix.
Version 7.0.0 also makes the linked identifiers character values. A numeric ID from one source and a character ID from another can otherwise fail to join. Identifiers are labels: keep leading zeros when they are meaningful, and do not expect character conversion to recover zeros already lost during import.
Keep biological observations connected too
Length and age records attach to interviews in the same way. They do not need a matching row number in the catch table. Several measured or aged fish can belong to one interview, and many interviews may have no biological records.
design <- design |>
  add_lengths(
    example_lengths,
    length_uid = interview_id,
    interview_uid = interview_id,
    species = species,
    length = length,
    length_type = length_type,
    count = count,
    release_format = "binned"
  ) |>
  add_ages(
    example_ages,
    age_uid = interview_id,
    interview_uid = interview_id,
    species = species,
    age = age,
    age_type = age_type
  )

print(design)
The shipped length example mixes individual harvested-fish measurements with binned release records. That is why this call specifies release_format = "binned" and supplies a count column. The count is the number of released fish in a bin, not an interview count. Length and age fate labels are "harvest" and "release", whereas the catch table uses "harvested" and "released". The add_lengths() and add_ages() references describe those formats.
An interview ID identifies the interview, not an individual fish. If a project needs to match a fish’s length to its age, retain a separate fish or specimen identifier in the source records. Interview and species alone cannot establish which measurement belongs to which aged fish.
These links preserve biological observations; they do not automatically make the measured fish representative of the entire catch. That still depends on which fish were available, which were selected for measurement, and the estimation method used.
Check the links before estimating anything
The attachment functions check that catch and biological records refer to interviews in the design. A record with an unknown interview ID should send us back to the source tables: was the ID mistyped, was an interview omitted, or were records drawn from different survey exports?
I would also check that the interview identifier uniquely identifies an interview across the data being combined. If numbering restarts each year or at each water body, an ID such as "104" is not enough on its own. Construct a consistent identifier from the necessary source fields and use it in every related table before attachment.
A separate check asks whether the design has the expected field coverage:
check_completeness(design)For this workflow, that report identifies calendar days without count data and strata with few interviews. Its default low-interview threshold is 10; that is a diagnostic threshold, not proof that a sample is adequate for every survey. On the shipped example, the report finds no missing sampling days but flags one stratum below that threshold. That is a result to inspect, not an error in attaching the tables. The report also does not establish that every fish was measured or every species record was entered. Those checks require the field protocol and source records.
Before moving on, I would ask:
- Can I explain what a row represents in every table?
- Does each catch, length, and age record point to the intended interview?
- Are zero-catch interviews retained, and are missing records investigated?
- Have any joins repeated effort or turned measurements into extra interviews?
- Can another analyst distinguish observed sample summaries from expanded estimates?
The calendar defines the survey’s time structure. Interviews retain the trip information and sampling protocol. Linked catch and biological tables add detail without changing how many interviews occurred. Keeping those distinctions visible is what lets the next step—estimating effort, catch, and harvest—start from the observations the field crew actually collected.